AIS recognizes the impacts of climate change that may affect business continuity, arising from both extreme weather events that could disrupt telecommunications infrastructure and evolving regulatory requirements and stakeholder expectations related to climate issues. The Company therefore manages climate-related risks through a systematic approach encompassing network resilience enhancement (climate adaptation) and tangible greenhouse gas emissions (GHG emissions) reduction initiatives (climate mitigation). At the same time, as a national digital infrastructure provider, AIS continues to develop and expand technology services—including 5G, fiber optic networks, IoT, cloud, and data centers—to support businesses in improving resource efficiency, reducing GHG emissions, and accelerating the transition to a low-carbon economy, while fostering balanced and sustainable growth in harmony with society and the environment.
Target
2030
Reduce GHG emissions intensity as calculated from the ratio of direct (GHG Scope 1) and indirect emissions (GHG scope 2) to data traffic, by 25% by 2030 compared to the 2024 baseline
Note: AIS has applied this target since 2024 due to a recent acquisition, which has resulted in a significant change in greenhouse gas (GHG) emissions.

Performance
2025
Greenhouse gas emissions (Scope 1 and 2)
intensity was 0.016 tCO2 e per data traffic, representing a
intensity was 0.016 tCO2 e per data traffic, representing a
9%
reduction compared with the 2024 base year
Management Approach
Climate Governance
AIS has established a systematic climate change governance structure, spanning from policy oversight to operational implementation.
- Board of Directors: Provides strategic direction and oversees overall performance.
- Sustainable Development Committee: Formulates policies, sets targets, and monitors progress.
- Management Committee and Senior Executives: Drive strategy execution across all business units.
This governance framework encompasses risk management, GHG emissions reduction, and business adaptation measures to support the Company’s long-term objectives and sustainable growth.
AIS has established environmental policies to serve as guidelines for operations throughout the business value chain, with the following objectives:
To reduce negative impacts from business operations on the environment and natural resources
To improve resource efficiency in business operations as deemed appropriate
To assess and manage risks associated with climate change and the environment and strictly comply with environmental standards and regulations
To conserve the environment and protect our planet
To promote digital solutions that help users and businesses cope with environmental challenges
The Company’s climate change response strategy comprises two main approaches:
- Climate Adaptation: AIS focuses on strengthening the robustness and resilience of its infrastructure and operations to address risks arising from extreme weather events. Climate resilience considerations are integrated into investment planning, asset management, and business continuity planning to ensure long-term service readiness, stability, and continuity.
- Climate Mitigation: AIS implements a comprehensive GHG emissions reduction approach, covering energy efficiency improvements, the use of renewable energy, the transition to electric vehicles, and the management of emissions across the value chain. These efforts are supported through collaboration with suppliers, the promotion of digital services, and the support for the development of low-carbon solutions.
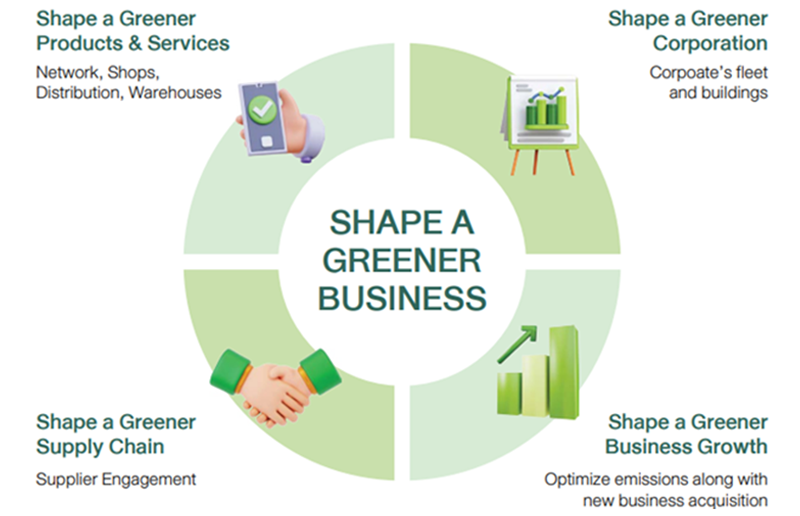
Decarbonization Roadmap
The Company has developed a Decarbonization Roadmap to address transition risks arising from new climate change–related policies and regulations. The roadmap comprises four key pillars:
- Greener Products & Services – Enhancing production and service processes to improve energy efficiency through AI and innovation; upgrading network equipment and data centers; designing energy-efficient retail stores and warehouses; and installing solar PV systems at base stations, switching centers, data centers, and other facilities.
- Greener Corporation – Improving the operational efficiency of support functions, including enhancing energy efficiency in buildings and transitioning internal combustion vehicles to hybrid and electric vehicles (EVs).
- Greener Supply Chain – Procuring low-carbon products and services and supporting suppliers in strengthening their capabilities to address climate change–related challenges.
- Greener Business Growth – Integrating climate considerations into the assessment and planning of future business expansion investments
The Company is committed to managing its investments and expenditures in alignment with its GHG emissions reduction target by incorporating GHG emissions considerations into investment decision-making and procurement processes within the annual budgeting framework. Projects with the potential to generate GHG emissions are assessed to identify lower-emissions alternatives, supported by evaluations of technical and financial feasibility. This approach aims to ensure that capital allocation decisions are informed by decarbonization considerations and are aligned with the Company’s carbon reduction targets in an effective and sustainable manner.
2025 Performance
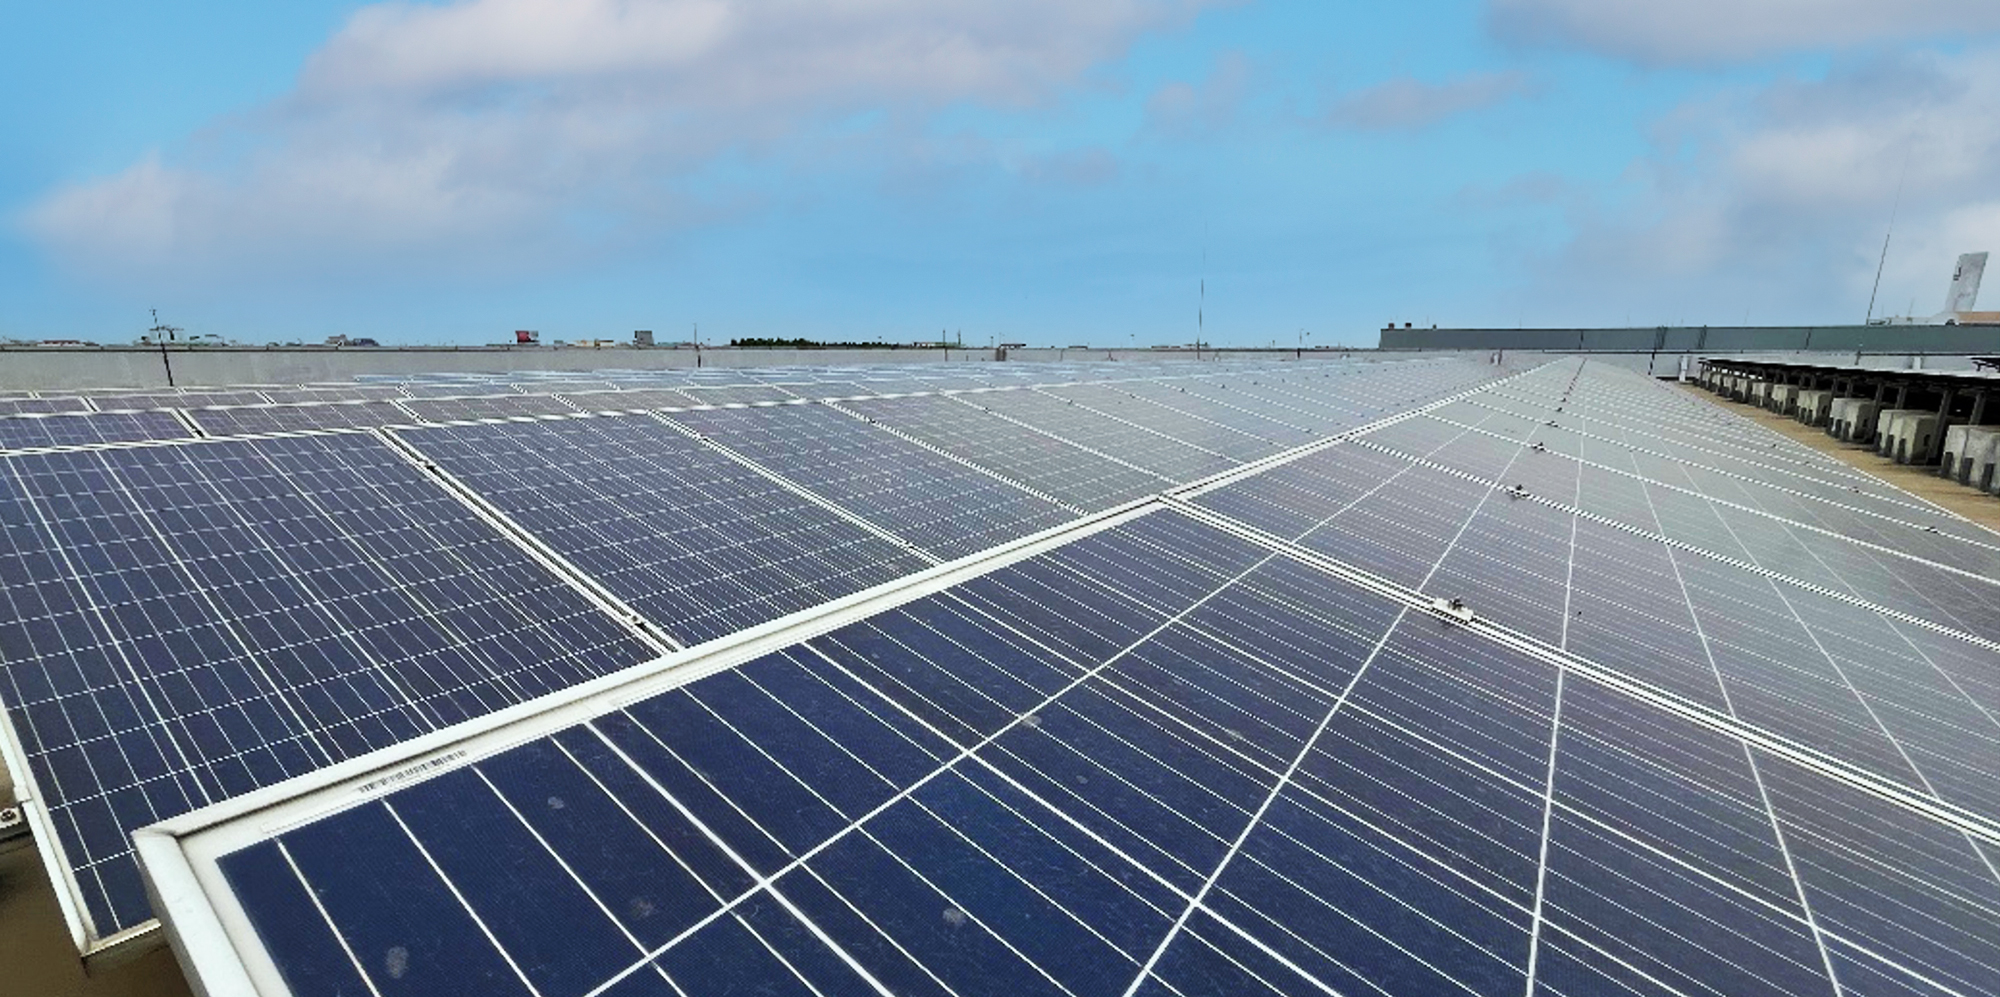
Renewable Energy Utilization
In 2025, AIS increased the share of renewable energy use through the additional installation of solar photovoltaic systems at base stations and switching buildings, supporting the adoption of clean energy in its operations. This approach aligns with the objectives of the Thailand Taxonomy for environmentally sustainable economic activities and reflects AIS’s commitment to integrating sustainability principles into the assessment and development of its business activities, supporting the transition toward long-term sustainable growth.
Total renewable sources
13,482 locations
Generated
60,106 MWh of renewable
electricity per year
electricity per year
Reduced GHG emissions by
30,047 tCO2e per year
AI-Enabled Network Energy Efficiency Program
AIS has deployed artificial intelligence (AI) to manage energy consumption at base stations across all regions nationwide. The AI system analyzes network usage patterns, such as traffic load and user behavior, by location and time period, enabling automated and dynamic adjustment of network equipment operations in line with actual demand. This supports continuous energy efficiency optimization across the network.
Achieved electricity savings of
38,321 MWh per year
Reduced GHG emissions by
19,157 tCO2e per year
Energy Efficiency Program through Equipment Management at Data Center
The Company continues to enhance the energy efficiency of its data centers through regular assessments of equipment utilization to identify assets that have reached end of service or have deteriorated to a level where repairs are no longer cost-effective, followed by appropriate decommissioning to eliminate inefficient energy use. In the current year, these measures have been implemented at three data centers, with plans to expand implementation to additional data centers in subsequent phases as part of a continuous improvement approach. As result, this initiative could perform electricity savings of 876 MWh per year and a reduction of 416 tCO2e per year in GHG emissions.
In addition to the key initiatives outlined above, the Company continues to implement projects under its Decarbonization Roadmap through 2030. These include the development of smart cooling systems, energy efficiency upgrades in buildings, the adoption of energy-saving technologies, and the promotion of low-emission vehicles, all aimed at reducing energy consumption and supporting sustainable long-term business operations. Further details are available in the Sustainability Report 2025.
Environmental Management System Development and training for employees
AIS has obtained ISO 14001:2015 certification for two of its data centers, following independent third-party audits. In addition, the company conducts annual internal audits of its other data centers, led by certified Internal Auditors trained in ISO 14001 standards. Moreover, AIS provides learning courses for employees in related departments to enhance their understanding and expertise in applying environmental standards from ISO 14001:2015 and energy management standards from ISO 50001 on their jobs. See more detail in Environmental Management System certification under the Related Documents.
Climate Policy Engagement and Responsible Industry Alignment
AIS demonstrates its support for climate change mitigation by aligning its operations and management practices with emerging climate-related regulations and public policies, such as the draft Climate Change Act and the draft Waste from Electrical and Electronic Equipment (WEEE) Act, which aims to strengthen greenhouse gas (GHG) management, emissions reporting, and responsible e-waste management. AIS has actively participated in public consultations on the adoption of IFRS Sustainability Disclosure Standards, including IFRS S1 and S2, contributing feedback to support their practical implementation and alignment with Thailand's regulatory and business context. AIS incorporates these considerations into its climate governance, GHG data management, climate risk assessment, and e-waste management practices, while actively monitoring policy developments and engaging with regulators and relevant stakeholders to support practical policy implementation.
AIS is committed to maintaining consistency between its climate change policy and the positions of trade associations of which it is a member, including TBCSD (Thailand Business Council for Sustainable Development) and GSMA (Global System for Mobile Communications Association). Through active participation and collaboration, AIS supports initiatives related to renewable energy, circular economy, and e-waste management. Through continuous engagement with these associations and organizations, AIS contributes to industry action, knowledge sharing, and the development of sustainability practices, while maintaining alignment between the Company’s climate and e-waste management strategies and those of the associations and organizations of which it is a member.
Water Management at AIS
AIS operates in the telecommunications sector, which by nature is not a water-intensive industry compared with heavy manufacturing. The Company’s water use primarily relates to domestic consumption in office buildings and operational facilities. However, two of the Company’s data centers (out of a total of 11) use water as a cooling medium and therefore account for a higher level of water consumption compared with general operations. As a result, AIS places strong emphasis on robust and efficient water management at these sites. Site-specific water management actions include sourcing water exclusively from legally authorized municipal water suppliers, with no direct abstraction from natural water bodies. The Company actively monitors and optimizes cooling water circulation rates to reduce freshwater intake, alongside regular maintenance and repair of cooling equipment to prevent water loss and improve system efficiency.
To ensure responsible water use and environmental compliance, AIS conducts regular monitoring of water quality and wastewater discharge. Water quality testing is performed by independent third parties, and the volume and quality of wastewater are routinely measured to ensure compliance with applicable environmental laws and regulatory standards. In 2025, the Company incurred approximately THB 3 million in costs related to the management of water-related risks, primarily for maintenance and efficiency improvements to data center cooling systems, supporting operational continuity and effective water use management.
Company-wide water efficiency actions are applied across other asset types, including office buildings, switching centers, and warehouses, where water is used mainly for general consumption. The Company promotes efficient water use and ongoing employee awareness to reduce unnecessary water consumption in daily operations. Wastewater is treated responsibly in accordance with environmental requirements prior to discharge into public systems. For leased properties, where primary responsibility for water management rests with property owners, AIS implements appropriate supplementary measures to support responsible water use and water quality, such as installing water filtration systems where necessary and coordinating to ensure that wastewater treatment systems meet environmental standards.
In addition, stakeholder engagement in water-stressed areas is conducted through regular communication and coordination with water supply providers, particularly in locations that may face water stress. These engagements support assessments of water availability and preparedness for potential supply disruptions. The Company’s business continuity management framework includes provisions for water storage and alternative water sourcing in emergency situations, with due consideration given to potential impacts on local communities and other stakeholders.
Biodiversity and Forest Protection
In line with the commitment to expand its telecom and internet services across the country, AIS has installed network infrastructure, especially base stations to extend network coverage to people in all areas. Nevertheless, such infrastructure expansion may be proximate to areas of biodiversity such as national parks, wildlife sanctuaries, environmental protection areas, etc. Recognizing the importance of conserving and protecting biodiversity and the ecological system, AIS ensures that all infrastructure installations are conducted in compliance with legal requirements. In addition, the Company has adopted internationally recognized indicators to monitor the performance to achieve No Net Loss (NNL), which is a goal for a development project in which impacts on biodiversity it causes are balanced by measures taken so that no loss remains, and No Net Deforestation by 2027.
Also, AIS conducted a preliminary report of biodiversity risk assessment in 2023 and reviews the assessment results and measures on a yearly basis. If significant changes occur such as change in nature of business, domestic laws, international standards, etc, the Company will carry out a new biodiversity risk assessment. In risk assessment, both dependency-related risks and impact-related risks from business operations will be taken into consideration.
The assessment shows that there were 1,654 AIS base stations located in or within a 1 km radius of the areas with biodiversity. AIS has established guidelines for risk management and minimizing the impact on biodiversity, starting from site selection, design, construction, operation, and maintenance of its base stations.
Value Chain Management
Supplier Engagement
AIS places strong emphasis on ongoing sustainability engagement with its suppliers. In 2025, the Company conducted engagement sessions with key suppliers across five regions nationwide to communicate its climate change strategy, targets, and implementation approaches, and to encourage suppliers to support GHG emissions reduction across the Company’s value chain. This included sharing guidance on data collection and methodologies for assessing Scope 1 and Scope 2 GHG emissions, as well as providing initial examples of emissions reduction practices applicable to suppliers’ operations. During the year, AIS engaged with a total of 57 suppliers, covering a diverse range of business sectors.
Customer Engagement
AIS enhanced the myAIS application as a centralized digital transaction platform to serve diverse customer needs, supporting the transition to fully digital transactions (Full-E) that are convenient and user-friendly. Continuous improvements were made to user experience, enabled customers to manage transactions and services independently with greater convenience and efficiency. As a result, the number of transactions conducted through the myAIS application increased by 21% compared with the previous year. In parallel, the adoption of e-Bill and e-Receipt services continued to grow, reaching a total of 298 million transactions, contributing to reduced paper use and travel.
Reduced GHG emissions by
27,095 tCO2e per year
Performance Table
| Topic | Unit | 2022 | 2023 | 2024 | 2025 |
|---|---|---|---|---|---|
| GHG Emission | |||||
| Total GHG emissions (Scope 1 and 2) | tCO2e | 675,497 | 704,264 | 798,881 | 820,916 |
|
+ Direct GHG emissions (Scope 1)
|
tCO2e | 7,411 | 9,351 | 30,349 | 28,787 |
|
+ Indirect GHG emissions (Scope 2)
|
tCO2e | 668,086 | 694,913 | 768,532 | 792,129 |
|
- Location-based
|
tCO2e | 668,086 | 694,913 | 768,559 | 793,194 |
|
- Market-based
|
tCO2e | 668,086 | 694,913 | 768,532 | 792,129 |
| GHG intensity (scope 1 and 2) | tCO2e per terabytes | 0.032 | 0.026 | 0.018 | 0.016 |
| Indirect GHG emissions (Scope 3) | tCO2e | 456,538 | 414,205 | 729,107 | 638,547 |
|
+ Category 1: Purchased Goods & Services
|
tCO2e | 234,742 | 179,328 | 191,612 | 211,642 |
|
+ Category 2: Capital Goods
|
tCO2e | 75,985 | 85,857 | 128,932 | 50,795 |
|
+ Category 3: Fuel- & Energy-related Activities
|
tCO2e | 89,963 | 100,310 | 154,494 | 147,483 |
|
+ Category 4: Upstream Transportation & Distribution
|
tCO2e | - | - | 9,399 | 10,555 |
|
+ Category 5: Waste Generated in Operations
|
tCO2e | - | - | 460 | 705 |
|
+ Category 6: Business Travel
|
tCO2e | - | - | 930 | 1,043 |
|
+ Category 7: Employee Commuting
|
tCO2e | - | - | 14,190 | 13,754 |
|
+ Category 8: Upstream Leased Assets
|
tCO2e | - | - | 82 | 89 |
|
+ Category 9: Downstream Transportation & Distribution
|
tCO2e | - | - | 0 | 0 |
|
+ Category 10: Processing of Sold Products
|
tCO2e | - | - | 0 | 0 |
|
+ Category 11: Use of Sold Products
|
tCO2e | 55,848 | 48,710 | 186,832 | 192,765 |
|
+ Category 12: End-of-life Treatment of Sold Products
|
tCO2e | - | - | 256 | 848 |
|
+ Category 13: Downstream Leased Assets
|
tCO2e | - | - | 8,031 | 8,868 |
|
+ Category 14: Franchises
|
tCO2e | - | - | - | - |
|
+ Category 15: Investments
|
tCO2e | - | - | - | - |
| Energy | |||||
| Total Energy Consumption | MWh | 1,394,989 | 1,456,351 | 1,694,322 | 1,751,026 |
| Terajoule | 5,022 | 5,243 | 6,100 | 6,304 | |
| Total non-renewable energy consumption | MWh | 1,370,796 | 1,423,592 | 1,642,405 | 1,690,920 |
| Terajoule | 4,935 | 5,125 | 5,913 | 6,087 | |
|
+ Direct energy consumption: Fuel and other
|
MWh | 34,356 | 33,488 | 105,033 | 106,345 |
| Terajoule | 124 | 121 | 378 | 383 | |
|
+ Indirect energy consumption: Electricity
|
MWh | 1,336,440 | 1,390,104 | 1,537,372 | 1,584,575 |
| Terajoule | 4,811 | 5,004 | 5,535 | 5,704 | |
| Energy from renewable sources | MWh | 24,193 | 32,759 | 51,917 | 60,106 |
| Terajoule | 87 | 118 | 187 | 216 | |
| % Energy from renewable sources | % To total energy consumption | 1.73 | 2.25 | 3.06 | 3.79 |
| Power Usage Effectiveness (PUE) at Data Centers | Unit | 1.505 | 1.502 | 1.58 | 1.55 |
| Total energy consumption in data centers | MWh | 83,851 | 89,629 | 117,214 | 121,984 |
| % Energy from renewable sources in data centers | % Total electricity consumption in data centers | 1.74 | 1.69 | 1.30 | 1.19 |
| Energy cost | Million baht | 5,798 | 6,877 | 7,628 | 7,505 |
| Total Water Use | |||||
| Water Withdrawal | Cubic Meters | 198,751 | 199,734 | 283,156 | 249,364 |
|
+ Municipal Water
|
Cubic Meters | 194,762 | 194,870 | 275,926 | 240,029 |
|
- Water Stress Area
|
Cubic Meters | - | - | - | 125,663 |
|
+ Ground Water
|
Cubic Meters | 3,989 | 4,864 | 7,230 | 9,336 |
|
- Water Stress Area
|
Cubic Meters | 3,989 | 4,864 | 7,230 | - |
| Water Discharge | Cubic Meters | 101,322 | 68,871 | 114,064 | 101,101 |
| Total Water Consumption | Cubic Meters | 97,429 | 130,863 | 169,092 | 148,263 |
Climate-related Reports

Related Documents
Further details, including other related initiatives, are available in the Climate Actions section of the Sustainability Report 2025.